Alerting and SLOs
Reliability is defined, measured, and defended with three linked terms - SLI, SLO, SLA - and an error budget. Alerting is how you defend it: build a policy that fires on the right condition, then spend the budget wisely by paging a human only when it matters. Metrics and uptime checks come from Cloud Monitoring; this page covers the alerting policies built on top of them and the SLOs that drive them.
SLI, SLO, and SLA
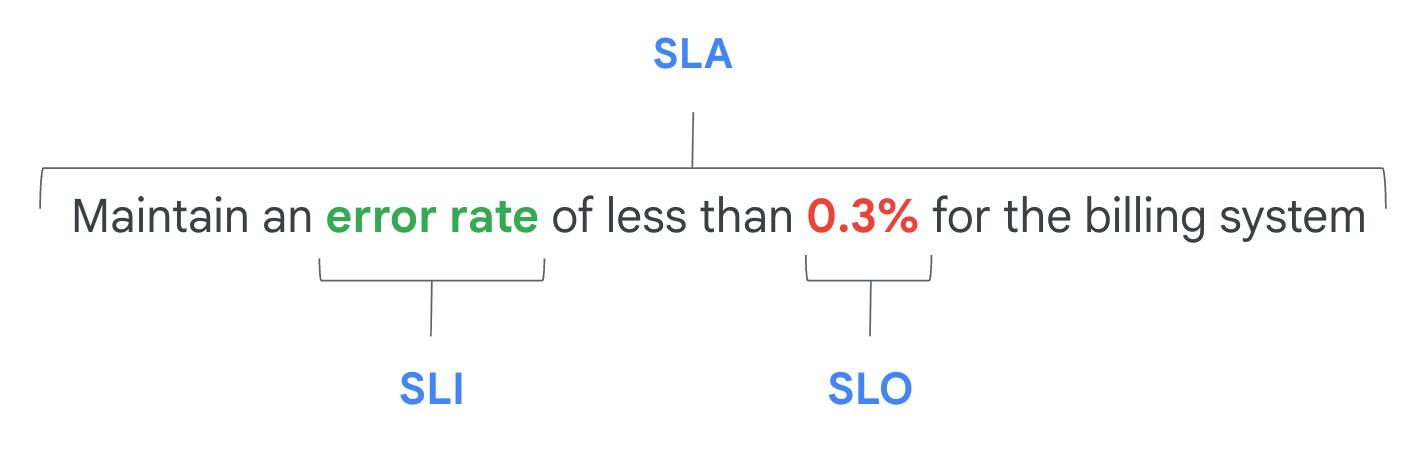
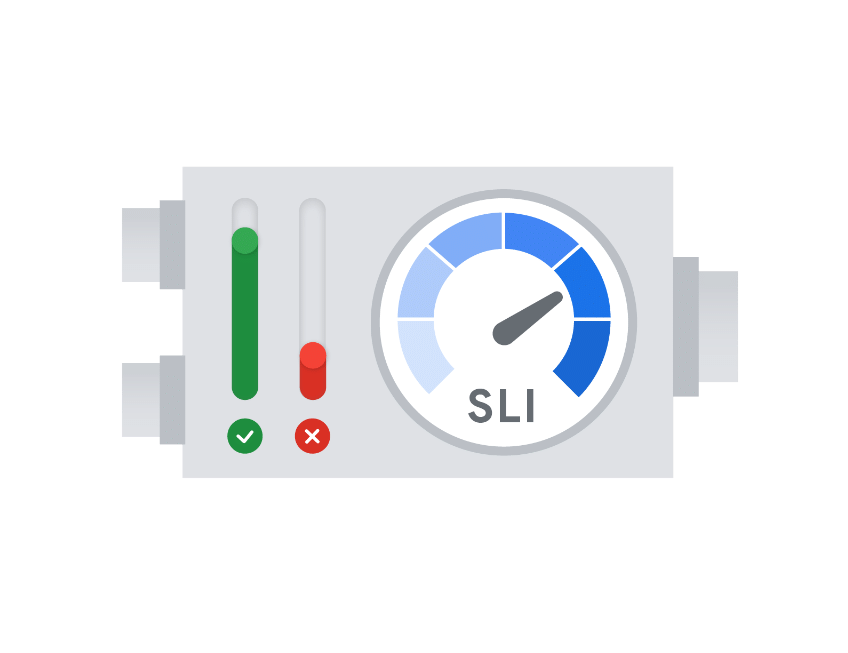
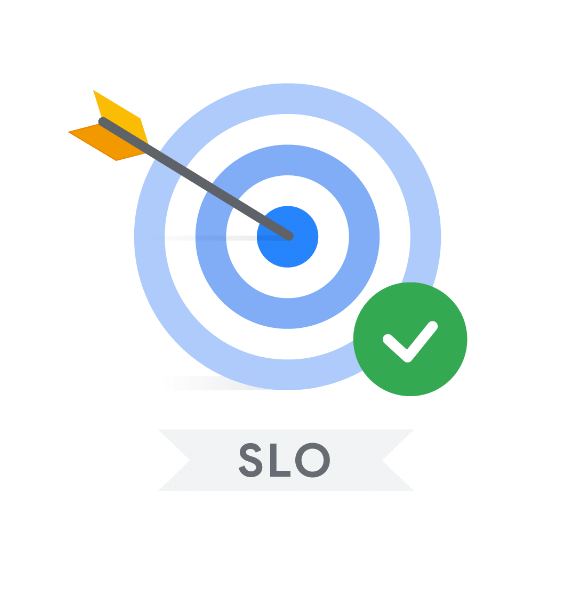
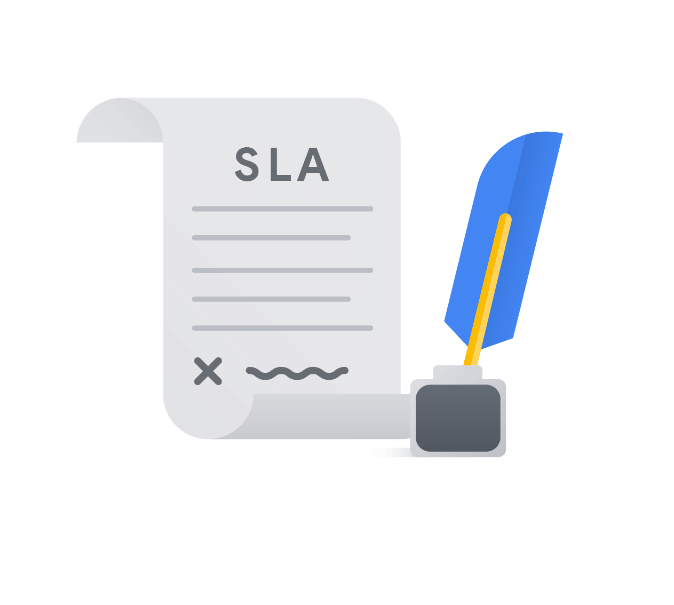
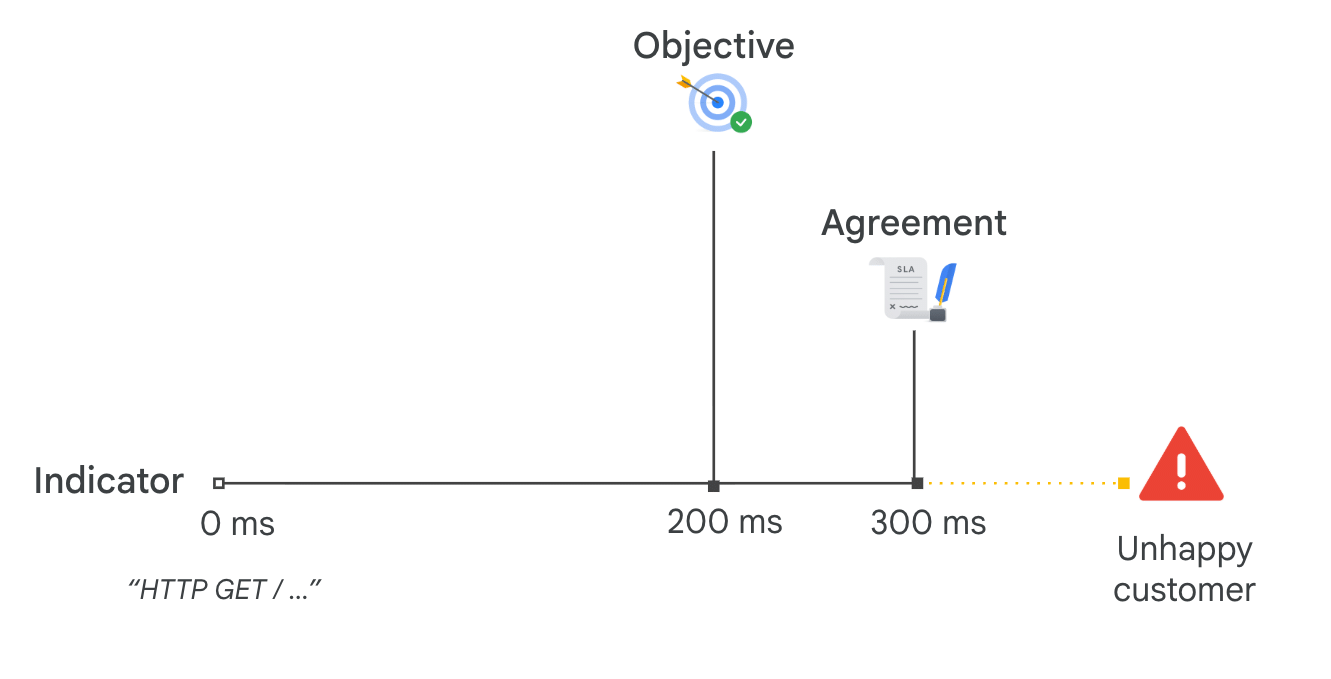
Classic ordering trap: the SLI is the number (error rate), the SLO is the target on it (< 0.3%), and the SLA is the customer contract that pays out when you miss. Example: "maintain < 0.3% error rate for billing" - error rate is the SLI, 0.3% is the SLO.
SMART SLOs
You can't measure everything, so choose SLOs that are S.M.A.R.T.
Error budgets
An error budget is 100% - SLO. If the SLO is "90% of requests return in 200 ms", the
budget is 10%. The budget is what you're allowed to spend on failures and risky changes. A
great time to alert is when you're trending to spend the whole budget before the time
window ends - not when it's already gone.
Just like breaching an SLA, being out of SLO should trigger concrete action - slow the rate of change, redirect engineering to reliability - and needs executive backing to enforce. An SLO nobody defends is decoration.
Alerting policies
An alerting policy = a name + condition(s) + notification channels + documentation. Notification channels are configured once and reused; direct-to-human ones are email, SMS, Slack, mobile app push, and PagerDuty, while Pub/Sub and webhook hand off to third-party systems.
The documentation field is a first-class part of the policy, not an afterthought: it
travels with every notification and gives the responder context - a runbook/playbook, links
to the right dashboard, and dynamic labels (${metric.label...}, ${resource...}) that
fill in the specifics of the firing incident. Treat it as the "easy button" that tells
whoever is paged what to do.
User-defined labels you attach to a policy also flow into the notification, so downstream systems can route and filter incidents by them (e.g. team, severity, service).
A policy can hold multiple conditions (e.g. one on CPU usage, another on reserved cores). A policy trigger decides how they combine: fire when all conditions are met (AND) or when any is met (OR).
Each condition reads IF metric CONDITION threshold FOR duration - the duration keeps a momentary spike from paging you.
Picking the wrong one is the difference between a noisy pager and a missed outage.
A classic trap: valid targets for an alert or uptime notification are channels - email, SMS, webhook, Pub/Sub, and third-party services (Slack, PagerDuty). An EC2 service (or any compute resource) is not a notification channel.
Metric-based vs log-based policies
Two policy types:
- Metric-based - track metric data collected by Monitoring (e.g. page a human when a VM's latency stays high). This is the default.
- Log-based - notify whenever a specific message appears in a log. Created from the Logs Explorer in Cloud Logging or via the Monitoring API. Example: alert when a human user accesses a service account's security key.
"Alert me if anyone reads the service-account key" is a log-based alerting policy built in Logs Explorer - not a metric threshold. Metric-based alerts watch numbers; log-based alerts watch for a matching log entry.
Condition types
There are three condition types for metric-based alerts:
- Metric-threshold - fires when the metric is above/below a threshold for a duration window (the common case, see the diagram above).
- Metric-absence - fires when there are NO measurements for a duration window (the service stopped reporting).
- Forecast - predicts future behaviour from past data and fires when a time series is predicted to violate the threshold within a forecast window (warns you before the breach).
"Alert if the metric stops arriving" = metric-absence (not a threshold of 0). "Warn me before I run out of disk" = forecast. Reaching for a plain threshold for these is the classic wrong answer.
Incidents and snooze
When a policy's conditions are met, an event occurs and Monitoring opens an incident. Incident states:
- Firing - open; conditions still met (or no data proving otherwise). Usually a new/unhandled alert.
- Acknowledged - a technician has marked it as being handled, signalling others.
A snooze temporarily suppresses new notifications for a policy or incident - useful during a known, escalating outage so you're not buried in repeat pages.
- Console, gcloud CLI, Monitoring API, and Terraform all create policies.
- Trick: build one in the Console, then
gcloud monitoring policies list+describeto get the JSON/YAML definition. - A policy can hold up to 6 conditions; a Terraform policy needs
display_name,combiner(how conditions combine), andconditions.
Alerting strategy
An alert is an automated notification sent through a channel to a person, system, or ticket when something needs to change (a service is down, an SLO is at risk). A good strategy balances four attributes.
Evaluating alerts
Window length
On a 99.9% availability SLO over 30 days: a short 10-min window alerts on a full outage in ~0.6 s and spends only ~0.02% of the budget, but it also fires on brief blips. A long 36-hr window catches a full outage in ~2 min and rarely false-alarms, but by the time that single alert fires it has already spent a full ~5% of the budget.
Strategies that get both precision and recall
Alert on symptoms (failing queries) rather than causes (the database is down), and use multiple notification channels (email and SMS) so there's no single point of failure. Customize each alert to its audience with the action to take. And don't page a human unless the alert crosses a criticality threshold - alerts fired on everything get ignored (alert fatigue), so if an alert doesn't lead to a specific action, question whether it should exist.
Service monitoring
Modern apps are many services, and one failure can look like many. Service Monitoring helps you define services, set SLOs and alerts on them, and see their health in one place. It can auto-discover candidate services of type: GKE namespaces, GKE services, GKE workloads, and Cloud Run services.
Request-based vs windows-based SLOs
If a system returns nothing but errors every Friday 9:00-9:05 but is perfect otherwise, a windows-based SLO averaged over long windows may never register a violation - even though real users hit the outage. Request-based counts every bad request.
Burn-rate alerts
Service Monitoring can alert when a service is trending to violate its SLO. It uses a lookback window to examine recent trend and a burn-rate threshold to decide. A burn rate of 1 would spend 100% of the error budget exactly by the end of the compliance period; a higher threshold means you're burning faster than sustainable. Example: a 60-minute lookback on a 7-day period, alerting if the trend would burn the whole budget in 1/10th of the period or faster. Compliance periods are calendar-based or rolling.
- Pick an SLI metric: Availability (successful responses / all responses), Latency (calls under a threshold / all calls), or Other (build your own in Metrics Explorer).
- Choose request-based or windows-based.
- Set a compliance period (calendar or rolling) and length, and a performance goal (%); the goal sets your error budget.
- Optionally attach a burn-rate alerting policy with a lookback window.